-->Ts=0.0001;

-->n=-1000:1000;

-->tn=n*Ts;

-->xn=2*cos(40*3.14159*tn).*cos(800*3.14159*tn);

-->plot(tn, xn);
This program shows the Beat waves for the equations given below
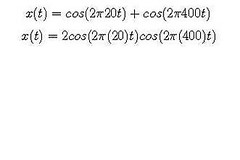
Equations for the two signals
The individual plots and the resultant beat wave is shown below
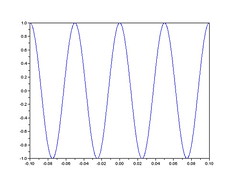
Plot of frequency equal to 20
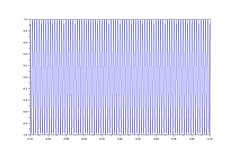
Plot of frequency equal to 400
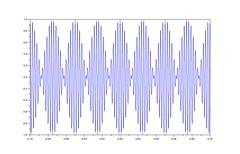
Resultant Beat Wave
This should come as no surprise, that beating forms the basis for Amplitude modulation.
The equation has been mentioned in Signal Processing First (© 2003, James H. McClellan Ronald W. Schafer, and Mark A. Yoder)


No comments:
Post a Comment